Writing Munin Plugins pt3: some Stats about VMWare Fusion
Bash . Graphics . Perl . VirtualisierungIn a project where we had the need for VMs being capable of doing CI for Java and also doing CI for iOS Application (using XCode Build Bots), we decided to go with a Mac OS Server as the Host Platform and using VMWare Fusion as the base Virtualisation System. We had several VMs there (Windows, Solaris, Linux and Mac OS). Doing a proper Monitoring for theses VMs was not that easy. We already had a working Munin Infrastructure, but no Plugin for displaying VMWare Fusion Stats existed.
The first approach was to use the included VMTools for gathering the information, since we already used them to start/stop/restart VMs via CLI/SSH:
#!/bin/bash

echo "starting VMS..."
VM_PATH=/Users/Shared/VMs
TOOL_PATH=/Applications/VMTools
$TOOL_PATH/vmrun -T fusion start $VM_PATH/Mac_OS_X_10.9.vmwarevm/Mac_OS_X_10.9.vmx nogui
or
#!/bin/bash

echo "starting VMS..."
VM_PATH=/Users/Shared/VMs
TOOL_PATH=/Applications/VMTools
$TOOL_PATH/vmrun -T fusion stop $VM_PATH/Mac_OS_X_10.9.vmwarevm/Mac_OS_X_10.9.vmx
But it was very hard to receive the interesting Data from the Log Files (statistica data is only really supported in VMWare ESXi). So we choose the direct way, to receive the live data, using ps. So this approach is also applicable for other Applications as well.
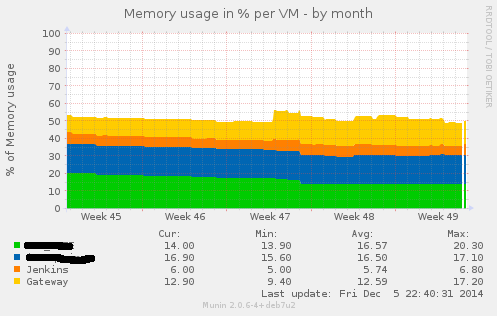
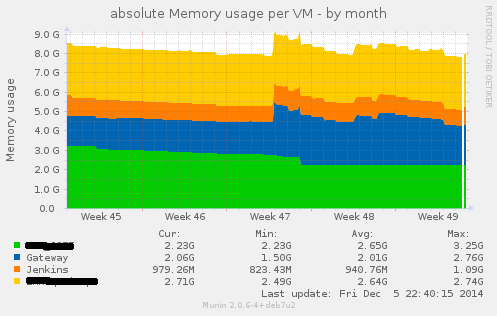
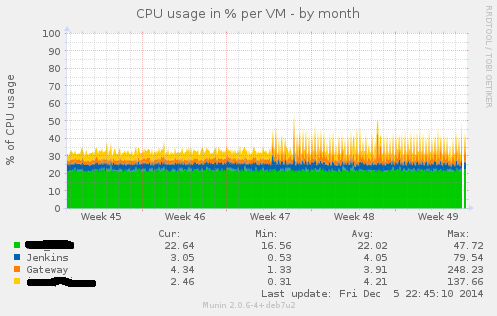
Our goal was to get at lease three Graphs (% of used CPU, % of used Memory and physically used Memory) sorted by VM Name.
ps -A | grep vmware-vmx
provides us with a list of all running vmware processes. Since we only need specific Data, we add some more filters:
ps -A -c -o pcpu,pmem,rss=,args,comm -r | grep vmware-vmx

29,4 14,0 2341436   J2EE.vmx                                                 vmware-vmx
1,7 12,9 2164200    macos109.vmx                                             vmware-vmx
1,4 17,0 2844044    windows.vmx                                              vmware-vmx
0,7  6,0 1002784    Jenkins.vmx                                              vmware-vmx
0,0  0,0    624     grep vmware-vmx
where this is the description (man ps) of the used columns:
- %cpu percentage CPU usage (alias pcpu)
- %mem percentage memory usage (alias pmem)
- rss the real memory (resident set) size of the process (in 1024 byte units).
You might see several things: First we have our data and the Name of each VM. Second, we have to get rid of the last line, since that is our grep process. Third, we might need to do some String Operations/Number Calculation to get some valid Data at the end.
Since Perl is a good choice if you need to do some String Operations, the Plugins is written in Perl :-).
Let’s have a look.
The Config Element is quite compact (e.g. for the physical mem):
my $cmd = "ps -A -c -o pcpu,pmem,rss=,args,comm -r | grep vmware-vmx";
my $output = `$cmd`;
my @lines=split(/\n/,$output);
...
if( $type eq "mem" ) {
    print $base_config;
    print "graph_args --base 1024 -r --lower-limit 0\n";
    print "graph_title absolute Memory usage per VM\n";
    print "graph_vlabel Memory usage\n";
    print "graph_info The Graph shows the absolute Memory usage per VM\n";
    foreach my $line(@lines) {
        if( $line  =~ /(?<!grep)$/ ) {
            my @vm = ();
            my $count = 0;
            my @array=split(/ /,$line);
            foreach my $entry(@array) {
                if( length($entry) > 2 ){
                    $vm[$count]=$entry;
                    $count++;
                }
            }
            $vm[3] = clean_vmname($vm[3]);
            if( $vm[3] =~ /(?<!comm)$/) {
                if( $lcount > 0 ){
                    print "$vm[3]_mem.draw STACK\n";
                } else {
                    print "$vm[3]_mem.draw AREA\n";
                }
                print "$vm[3]_mem.label $vm[3]\n";
                print "$vm[3]_mem.type GAUGE\n";
                $lcount++;
            }
        }
    }
}
After the basic Setup (Category, Graph Type, Labels, etc. ) we go through each line of the output from the ps command, filtering the line containing grep.
We use the stacked Graph Method, so the first entry has to be the base Graph, the following ones will just be layer on top of the first. To get clean VM Names, we have a quite simple function clean_vmname:
sub clean_vmname {
    my $vm_name = $_[0];
    $vm_name =~ s/\.vmx//;
    $vm_name =~ s/\./\_/g;
    return $vm_name;
}
The Code, that delivers the Data looks similar. We just piping the values from the ps command to the output:
foreach my $line(@lines) {
    if( $line  =~ /(?<!grep)$/ ) {
        my @vm = ();
        my $count = 0;
        my @array=split(/ /,$line);
        foreach my $entry(@array) {
            if( length($entry) > 2 ){
                $vm[$count]=$entry;
                $count++;
            }
        }
        $vm[3] = clean_vmname($vm[3]);
        if( $vm[3] =~ /(?<!comm)$/) {
            if( $type eq "pcpu" ) {
                print "$vm[3]_pcpu.value $vm[0]\n";
            }
            if( $type eq "pmem" ) {
                print "$vm[3]_pmem.value $vm[1]\n";
            }
            if( $type eq "mem" ) {
                my $value =  ($vm[2]*1024);
                print "$vm[3]_mem.value $value\n";
            }
        }
    }
}
You can find the whole plugin here on GitHub.
Here are some example Graphs you will get as a result:
Leave a Reply