Written by Philipp on 2014-12-05
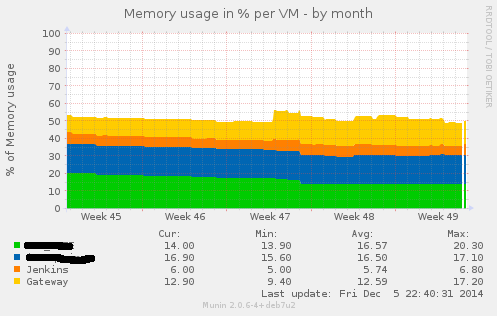
Writing Munin Plugins pt3: some Stats about VMWare Fusion
Bash . Graphics . Perl . VirtualisierungIn a project where we had the need for VMs being capable of doing CI for Java and also doing CI for iOS Application (using XCode Build Bots), we decided to go with a Mac OS Server as the Host Platform and using VMWare Fusion as the base Virtualisation System. We had several VMs there
Written by Philipp on 2014-08-18
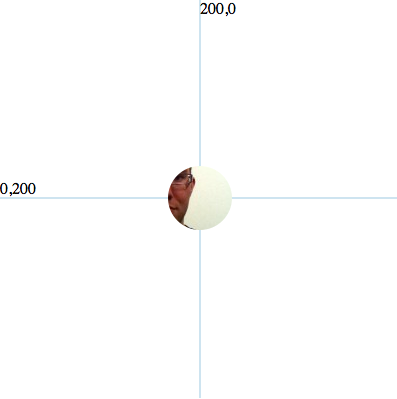
Adding Background Image to SVG Circles
Graphics . Tooling . UIIf you want to create nifty Graphics and Animation in the web, you cannot avoid d3.js. D3.js uses SVG as the basic Displaying Technologie. And sometimes you know, why SVG had such a hard time persuading developers. It is a simple task:Creating a Circle with an image as a background. The everyday Web-Developer would just
Written by Philipp on 2013-09-09
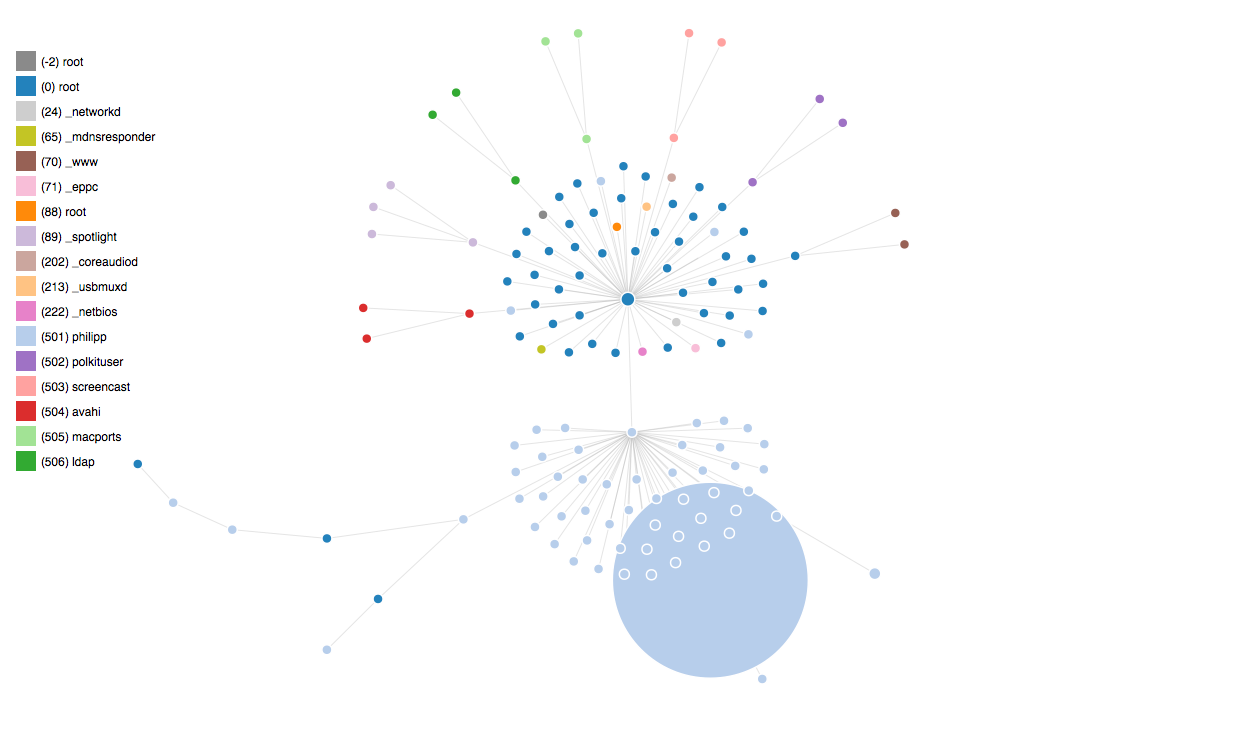
Plotting UNIX Processes with D3
Graphics . JavascriptI created another Plot, using D3js: You can find all Scripts here. I am still have to figure out how to do graph updates and add label to the nodes.
Written by Philipp on 2013-09-03
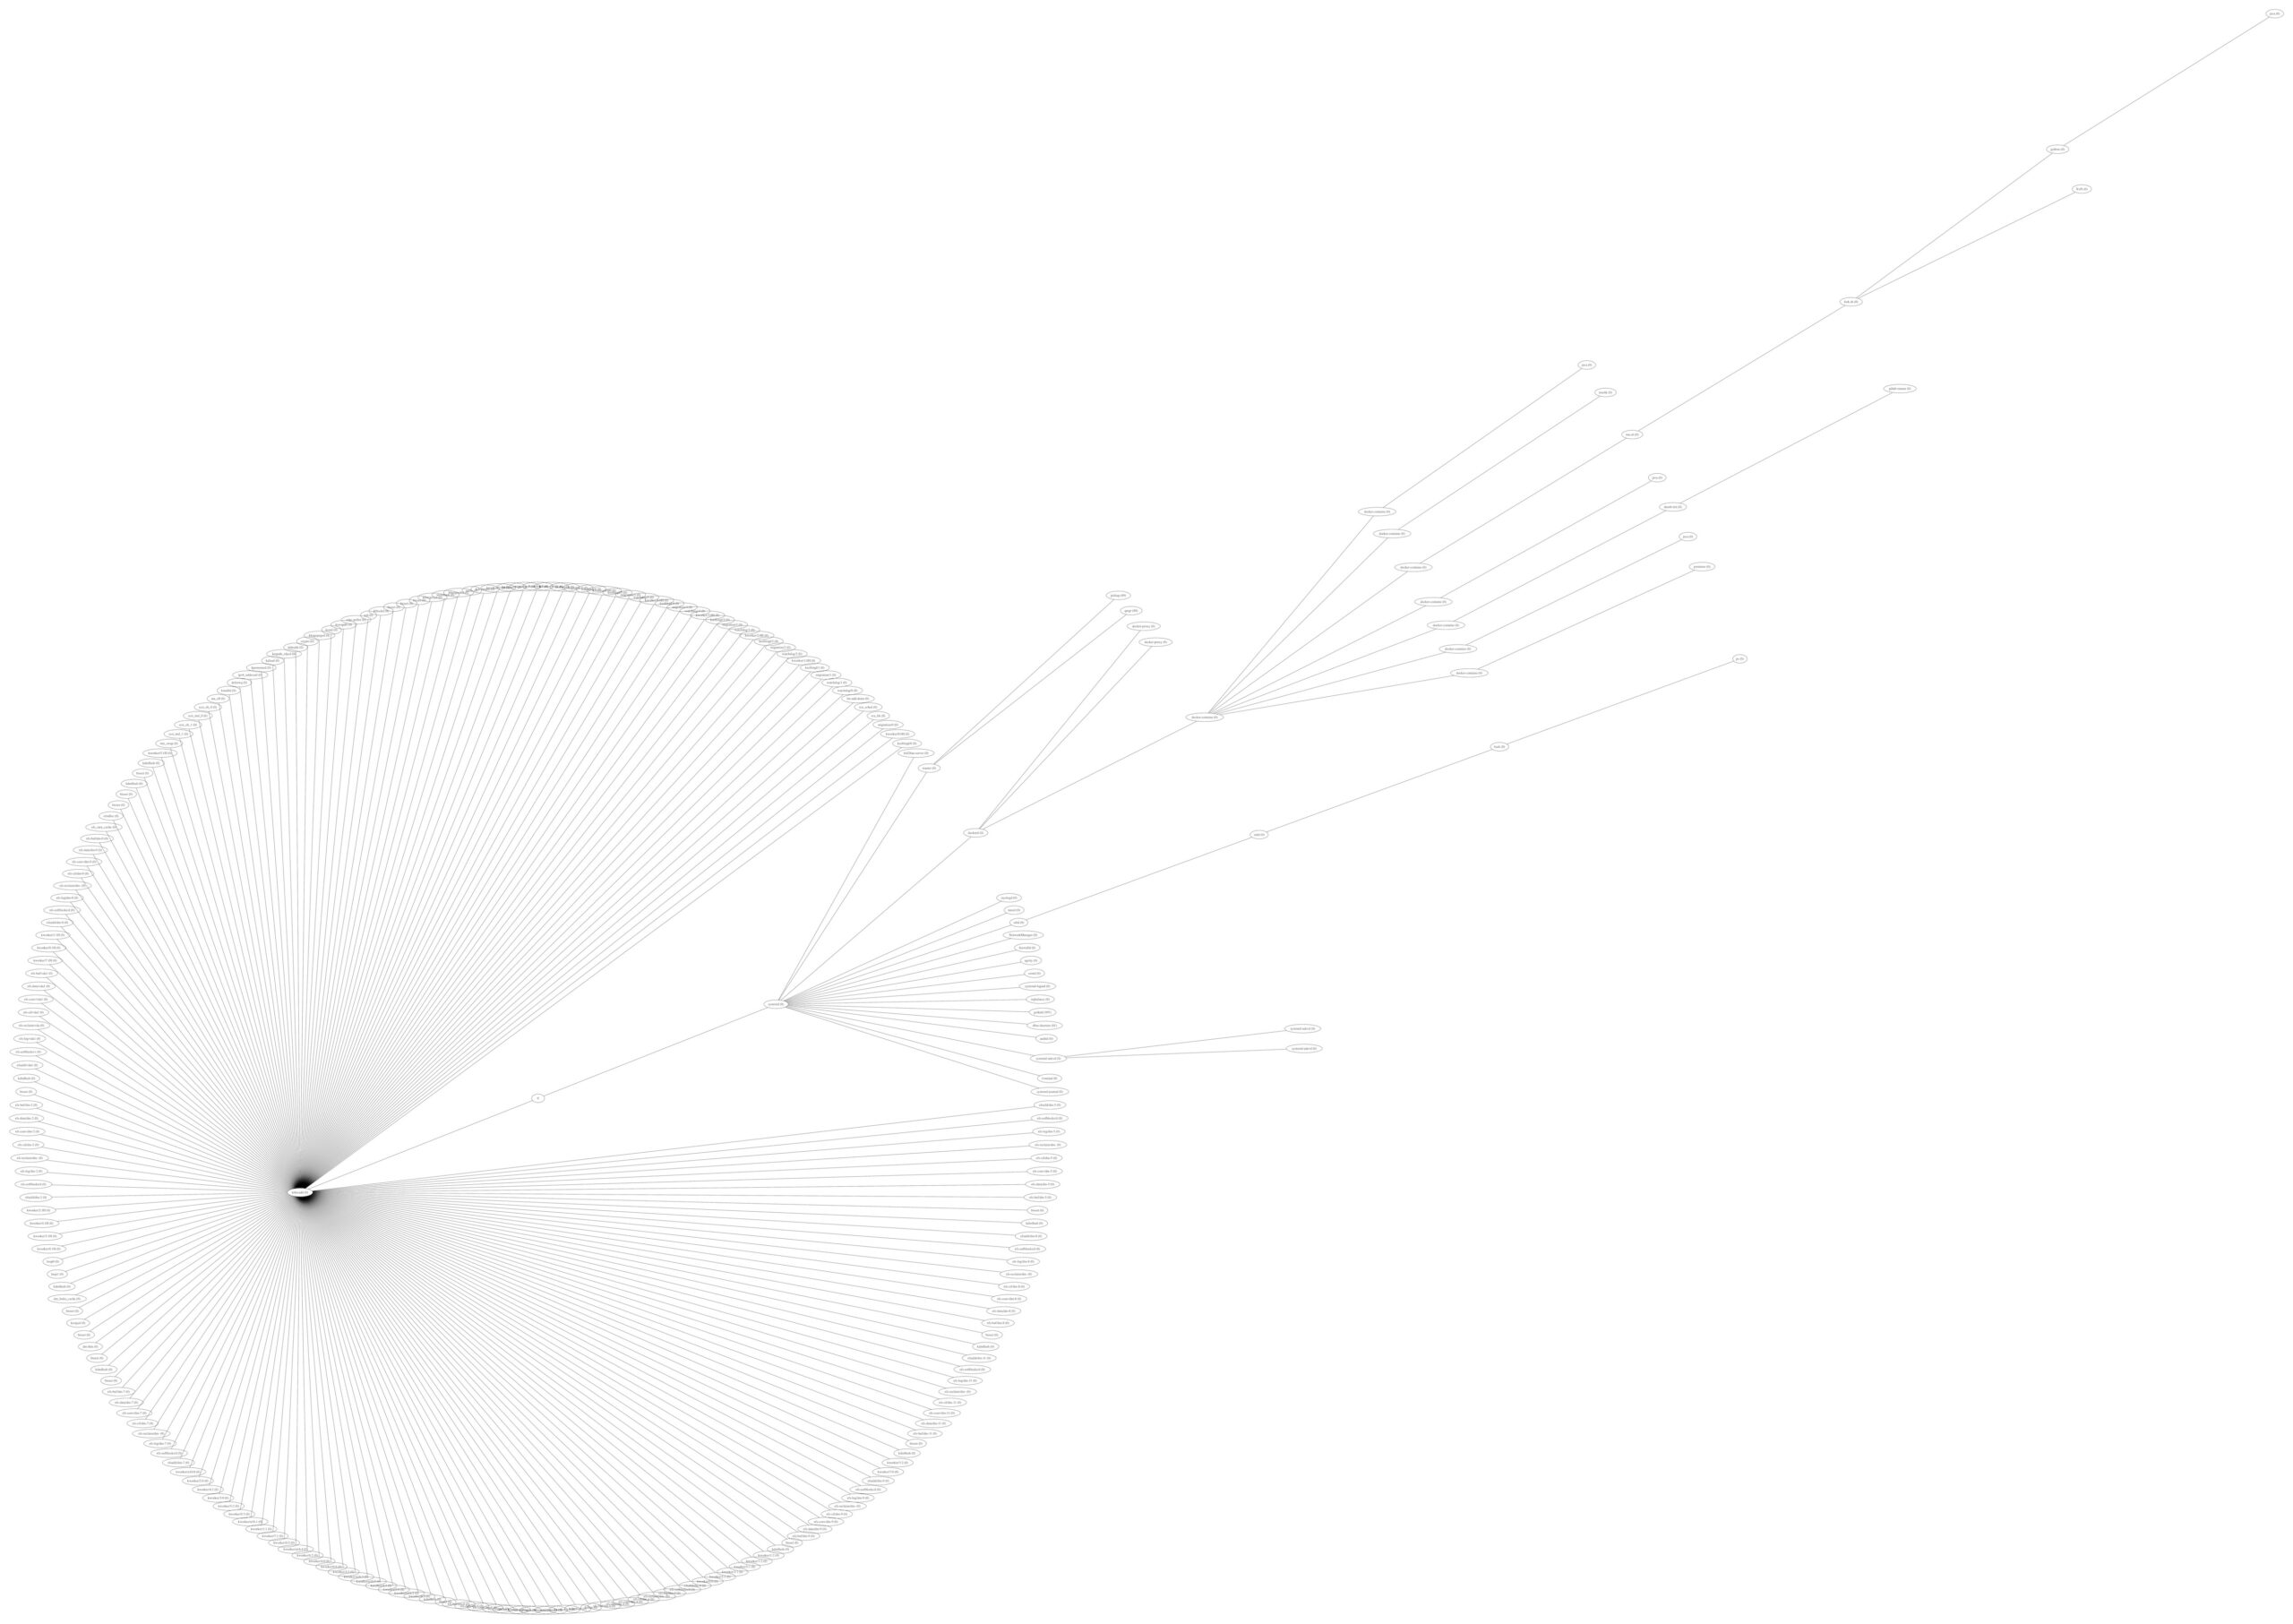
Plotting UNIX Processes with DOT
Graphics . Javascript . ToolingInspired by this Post this post, I started playing around with ps, nodejs and GraphViz. After reading some ps man Pages, i found the necessary ps parameters. For MacOS i used ps -A -c -o pid,ppid,pcpu,comm,uid -r For Linux i used ps -A -o pid,ppid,pcpu,comm,uid You then get some Output like: PID PPID %CPU COMMAND
Written by Philipp on 2012-03-21
SVG – the lost son of formats
GraphicsI was on the Chemnitz Linux Days last weekend. Besides great other talks a saw “Free your slides – Vortragsfolien im Browser anzeigen” from Sirko Kemter. He talked about a tiny tool called jessyink for creating Slides out of inkscape SVGs. I did a small SVG-Demo some months ago using RaphaelJS and a draft about
Written by Philipp on 2010-08-15
Philipps 5 mins: Graph-Fun with AJAX and Canvas
Graphics . Javascript . PHPI always searched for an efficient way add dynamic diagrams to a web-project without using flash or other plugin-based magic. With the support of the canvas tag element in almost all mainstream browser, i thought it would be a good time for creating a short demo how things workout. You will need at least two
Written by Philipp on 2008-05-10
Splines mit dem HTML Canvas Tag
Graphics . JavascriptSplines innerhalb eines Canvas Tags sind mit ein wenig Javascript recht schnell machbar! (drumherum dann noch den ganzen HTML-Kram denken): <canvas width=”150″ height=”150″ id=”myCanvas1″></canvas> <script type=”text/javascript”> function draw1(){ var myCanvas1 = document.getElementById(‘myCanvas1′); myCanvas1.style.border = “1px black dashed”; var ctx = myCanvas1.getContext(’2d’); ctx.beginPath(); ctx.strokeStyle = “#dedede”; for (i=1;i<15;i++){ ctx.moveTo(i10,0); ctx.lineTo(i10,150); } for(j=1;j<15;j++){ ctx.moveTo(0,j10); ctx.lineTo(150,j10); } ctx.stroke();