Written by Philipp on 2026-04-18
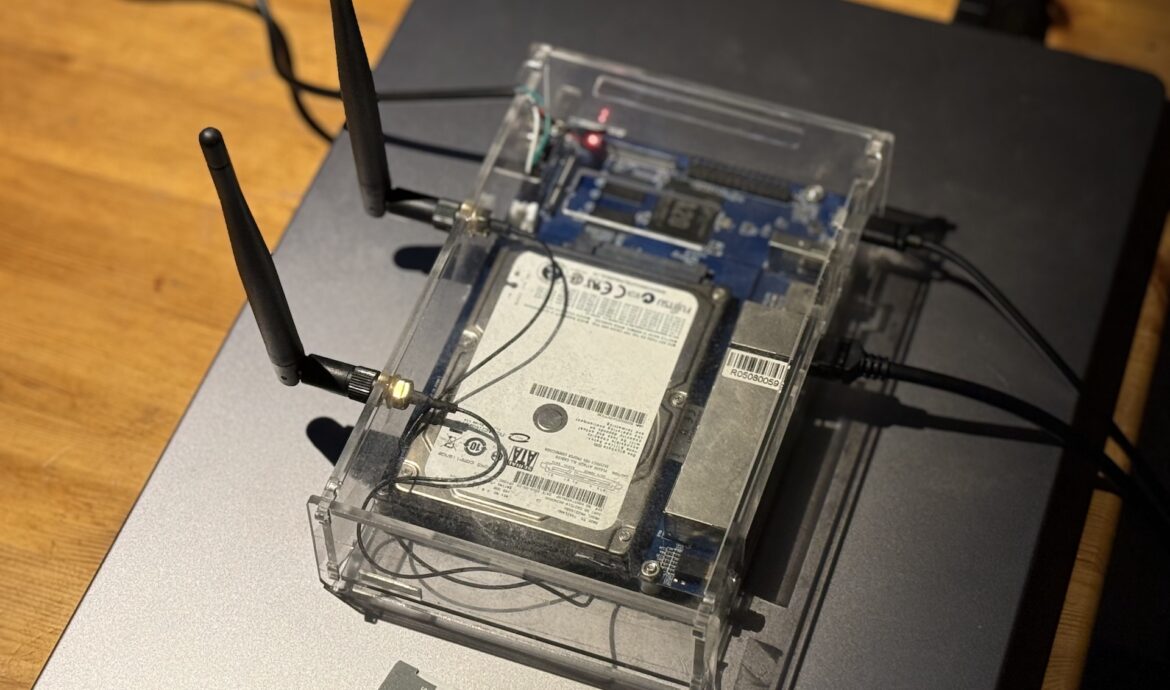
Running gokrazy on a Banana Pi BPI-R1
CLI . Go . Hacking . TestingMotivation I had a BPI-R1 sitting in a drawer. The board is from 2014 — only ancient OpenWrt and outdated Armbian images exist for it. Nobody maintains this platform anymore. The hardware is fine though: dual-core Allwinner A20, 1GB RAM, SATA, and a BCM53125 5-port Gigabit switch on the board. Not bad for a dedicated
Written by Philipp on 2020-04-26
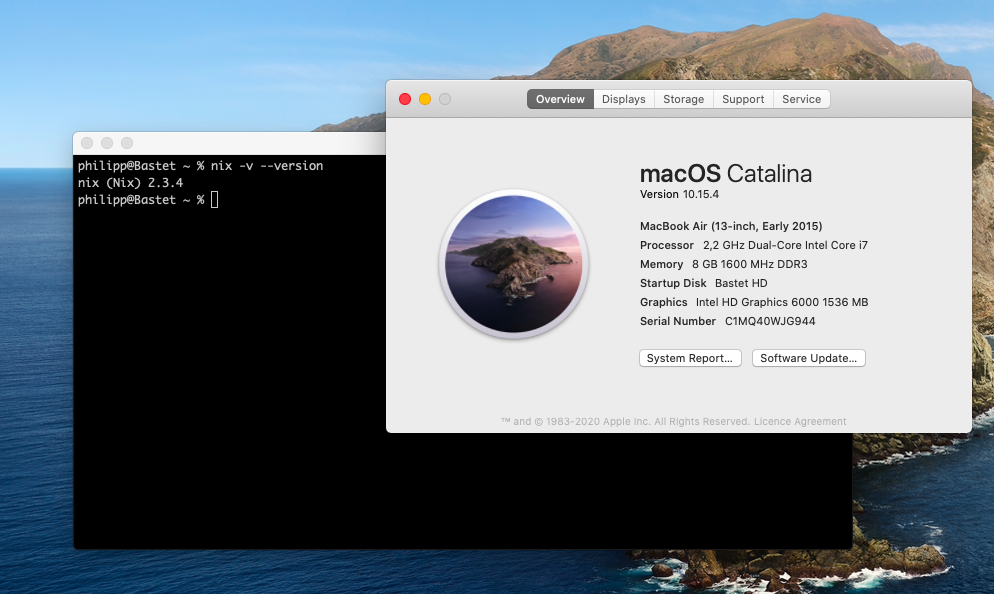
Fixing nix Setup on MacOS Catalina
Bash . CLI . Mac . PersonalWith MacOS Catalina (10.15), Apple decided to decrease the possibilities of system users to install software applications within the system. That means, that it is not possible anymore to install software at specific location in your system, since most system folder ware mounted read-only at boot to improve the overall system security. That leads to
Written by Philipp on 2016-02-14
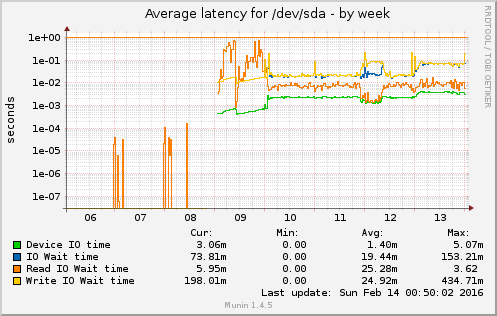
Disk failure and suprises
Bash . Proxmox . VirtualisierungOnce in a while – and especially if you have a System with an uptime > 300d – HW tends to fail. Good thing, if you have a Cluster, where you can do the maintance on one Node, while the import stuff is still running on the other ones. Also good to always have a
Written by Philipp on 2014-12-05
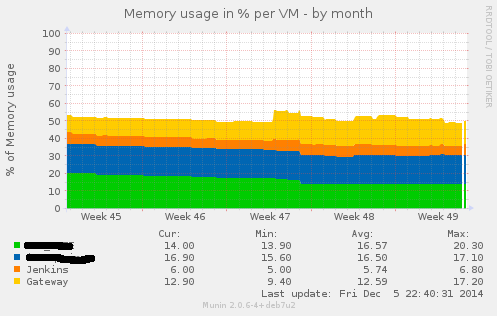
Writing Munin Plugins pt3: some Stats about VMWare Fusion
Bash . Graphics . Perl . VirtualisierungIn a project where we had the need for VMs being capable of doing CI for Java and also doing CI for iOS Application (using XCode Build Bots), we decided to go with a Mac OS Server as the Host Platform and using VMWare Fusion as the base Virtualisation System. We had several VMs there
Written by Philipp on 2014-06-22
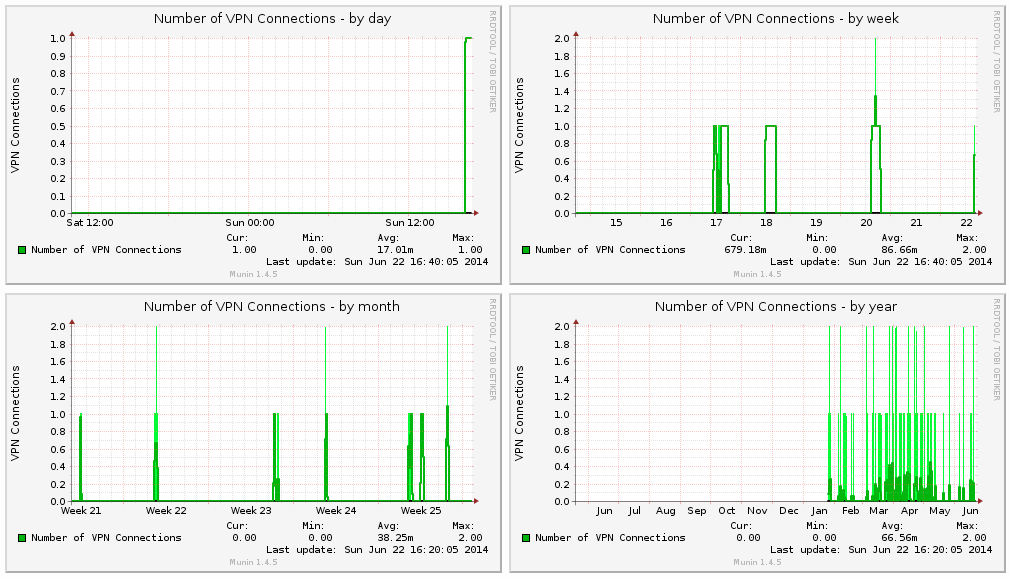
Writing Munin Plugins pt2: counting VPNd Connections
Mac . Network . Perl . ToolingPreamble Every Munin Plugin should have a preamble by default: #!/usr/bin/env perl # -*- perl -*- =head1 NAME dar_vpnd a Plugin for displaying VPN Stats for the Darwin (MacOS) vpnd Service. =head1 INTERPRETATION The Plugin displays the number of active VPN connections. =head1 CONFIGURATION No Configuration necessary! =head1 AUTHOR Philipp Haussleiter <philipp@haussleiter.de> (email) =head1 LICENSE

Written by Philipp on 2014-06-22
Writing Munin Plugins pt1: Overview
Bash . Mac . NetworkWriting your own Munin Plugins Around February this year, we at innoQ had the need for setting up a Mac OS based CI for a Project. Besides building of integrating some standard Java Software, we also had to setup an Test Environment with Solaris/Weblogic, Mac OS for doing a CI for an iOS Application and

Written by Philipp on 2014-03-28
Creating encrypted Volumes on ZFS Pools
Hacking . ZFSOne of the most anticipated Features of ZFS is transparent Encryption. But since Oracle decided to do not make updates from Solaris 11 availible as Open Source, the Feature of on-Disk Encryption is not availible on Illumos (e.g. Open-Source) based Distributions. But there are some ways to create transparent encrypted ZPools with current avaiblibe ZFS
Written by Philipp on 2013-09-09
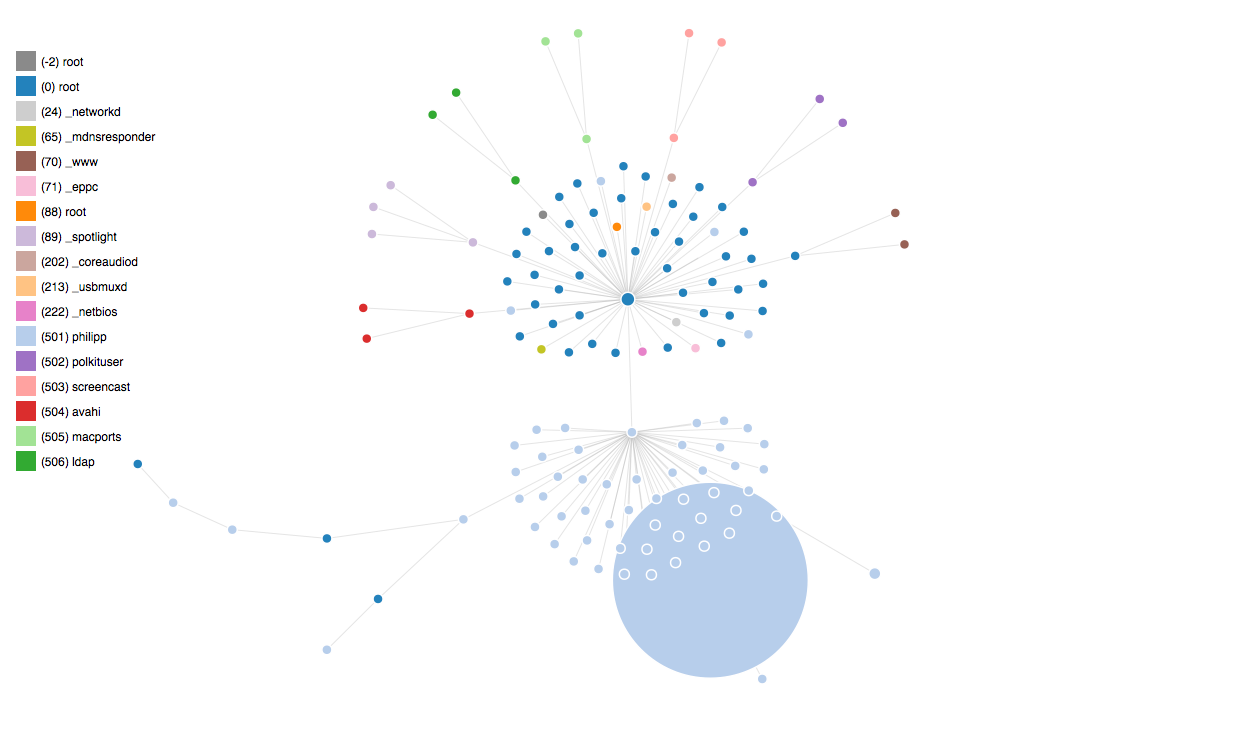
Plotting UNIX Processes with D3
Graphics . JavascriptI created another Plot, using D3js: You can find all Scripts here. I am still have to figure out how to do graph updates and add label to the nodes.

Written by Philipp on 2013-09-03
Plotting UNIX Processes with DOT
Graphics . Javascript . ToolingInspired by this Post this post, I started playing around with ps, nodejs and GraphViz. After reading some ps man Pages, i found the necessary ps parameters. For MacOS i used ps -A -c -o pid,ppid,pcpu,comm,uid -r For Linux i used ps -A -o pid,ppid,pcpu,comm,uid You then get some Output like: PID PPID %CPU COMMAND

Written by Philipp on 2013-08-04
Build and Test Project TOX under MacOS
Build . Hacking . Network . ToolingSome Steps to do You need to have XCode with installed CLI Tools (see here) If you are using MacPorts (you really should), you need to install all necessary Dependencies: port install libtool automake autoconf libconfig-hr libsodium cmake Checkout the Project TOX Core Repository: git clone –recursive https://github.com/irungentoo/ProjectTox-Core.git cd ProjectTox-Core cmake . make all You